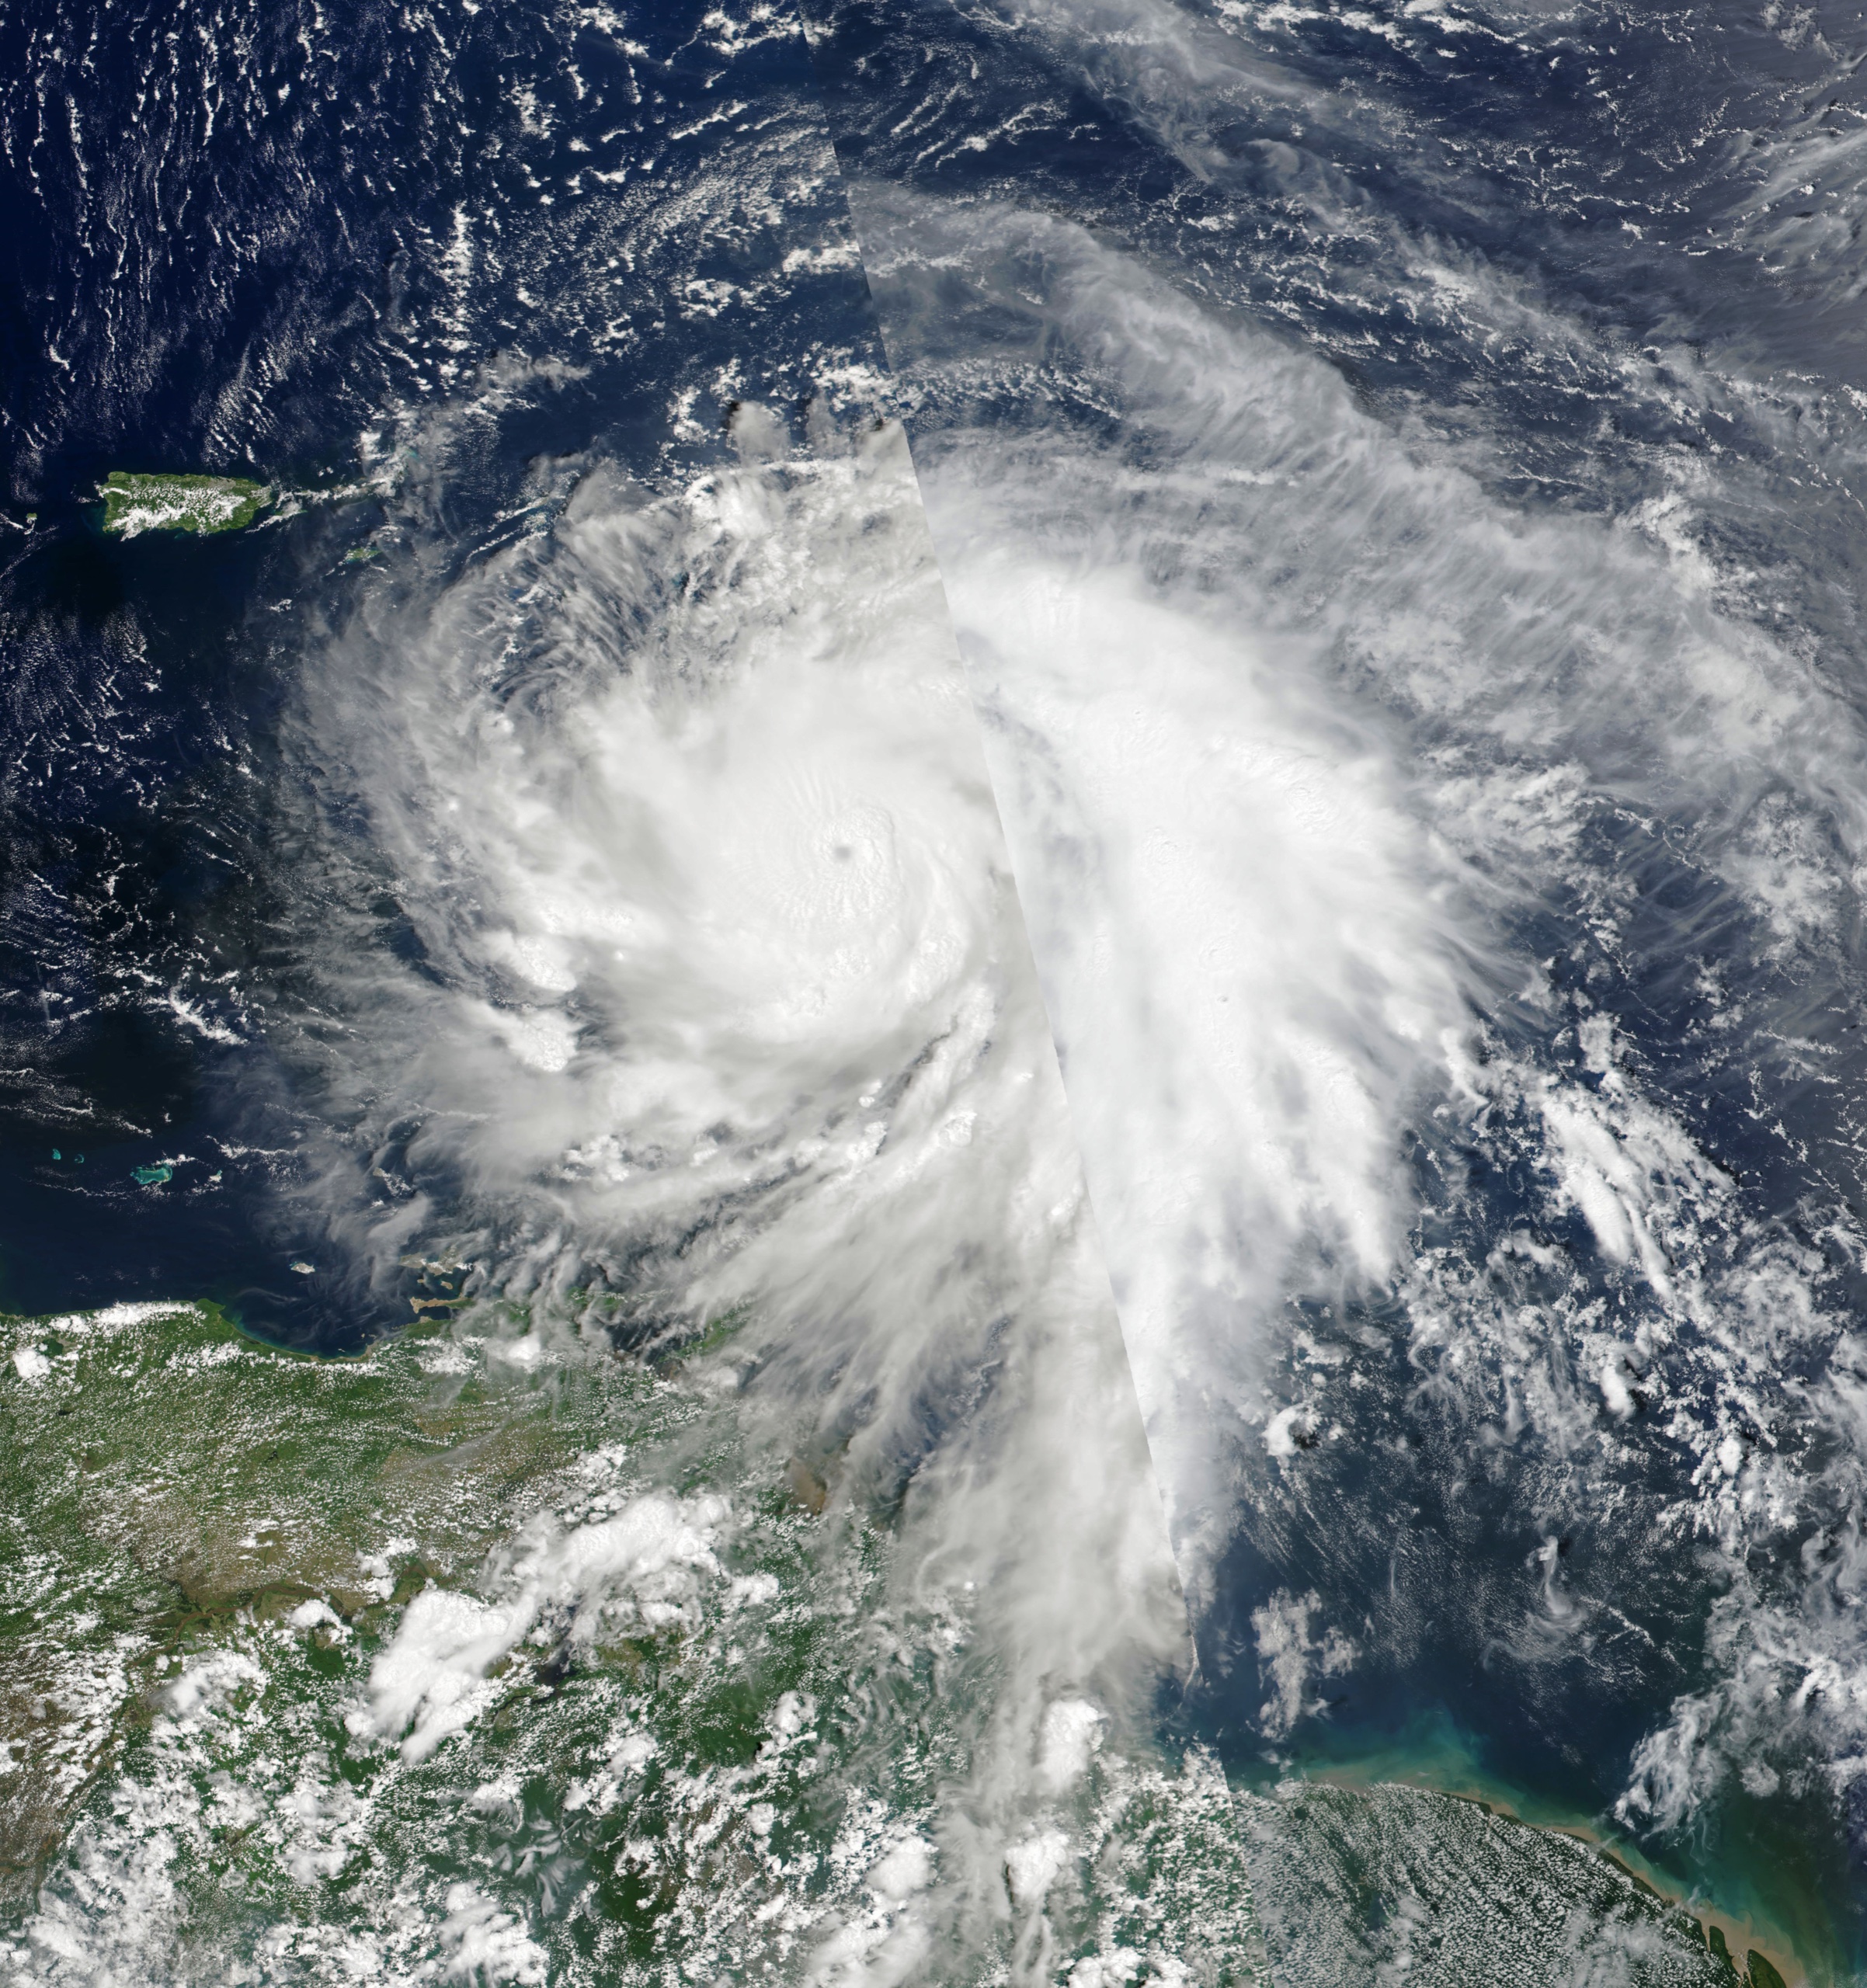
The research note treats rapid intensification as a kt gain in hours. That sentence is short on purpose. The failure mode is not the threshold. It is having the threshold in a paper and a different one in a notebook.
I write the inequality first, then I write the function that is allowed to implement it. If they disagree later, the function is wrong.
The inequality
Let be the best-track maximum sustained wind at a 6-hour fix. The 24-hour forward delta is four steps on that cadence:
A raw RI flag is then an indicator that also refuses post-landfall points. Those are a different physical problem, and they inflate a seasonal count if you leave them in.
A storm that stays above the threshold for hours is still one event. Consecutive trues collapse to the first fix:
The seasonal count is the number of storms in season with at least one onset, not the number of 6-hour flags.
That last line is the one people skip when they groupby a boolean and call it a frequency.
A series you can see
Six-hour for a toy storm that jumps through kt between and , then holds:
| (kt) | ||||
|---|---|---|---|---|
| — | — | — | ||
| — | — | — |
The useful timestamp is , not . If you plot every true as a pin on a basin map, you draw a smear. Onset is the pin.
The function
The pandas that matches the three equations, and nothing else:
import pandas as pd

RI_KT = 30
STEPS = 4  # 24 h at a 6-hour cadence

def ri_onset(vmax: pd.Series, land: pd.Series) -> pd.Series:
    """True on the first 6-hour fix of a ≥30 kt / 24 h jump."""
    delta = vmax.shift(-STEPS) - vmax
    raw = (delta >= RI_KT) & ~land.astype(bool)
    return raw & ~raw.shift(1, fill_value=False)


def seasonal_count(onset: pd.Series, storm: pd.Series, year: pd.Series) -> pd.Series:
    flagged = onset.groupby([year, storm]).any()
    return flagged.groupby(level=0).sum()
shift(-4) is the in . The ~raw.shift(1) is the . If you find yourself adding a rolling max or a “sustained for two fixes” clause, you are writing a second definition. Put it in the math first.
The same onset, if the record arrives as a typed fix instead of a frame:
export type IntensityFix = {
  t: string
  vmaxKt: number
  inland: boolean
}

export function onsetIndex(fixes: IntensityFix[]): number[] {
  const hits: number[] = []

  for (let i = 0; i + 4 < fixes.length; i++) {
    if (fixes[i].inland) continue
    const jump = fixes[i + 4].vmaxKt - fixes[i].vmaxKt
    const already = i > 0 && !fixes[i - 1].inland
      && fixes[i + 3].vmaxKt - fixes[i - 1].vmaxKt >= 30
    if (jump >= 30 && !already) hits.push(i)
  }

  return hits
}
I keep both. The frame is what I run on HURDAT2. The typed loop is what I want next to a service that has to emit “this storm just jumped” as an event, not as a column that someone will re-derive at 2 a.m.
What I will not do in the function
I will not smooth before the subtraction. A 6-hour best track is already an analysis. If a spike is wrong, that is a data problem, and it should fail a holdout, not disappear inside a rolling(3).mean().
I will not change to because a plot looks sparse. The Kaplan–DeMaria threshold is a convention. Conventions are allowed to be blunt. They are not allowed to drift per figure.
I will not count and call it . That quantity is hours spent intensifying, useful, and a different paper.
The earlier note is why the number matters after landfall. This one is only the contract: one inequality, one onset, one function, and a seasonal count that still means storms.