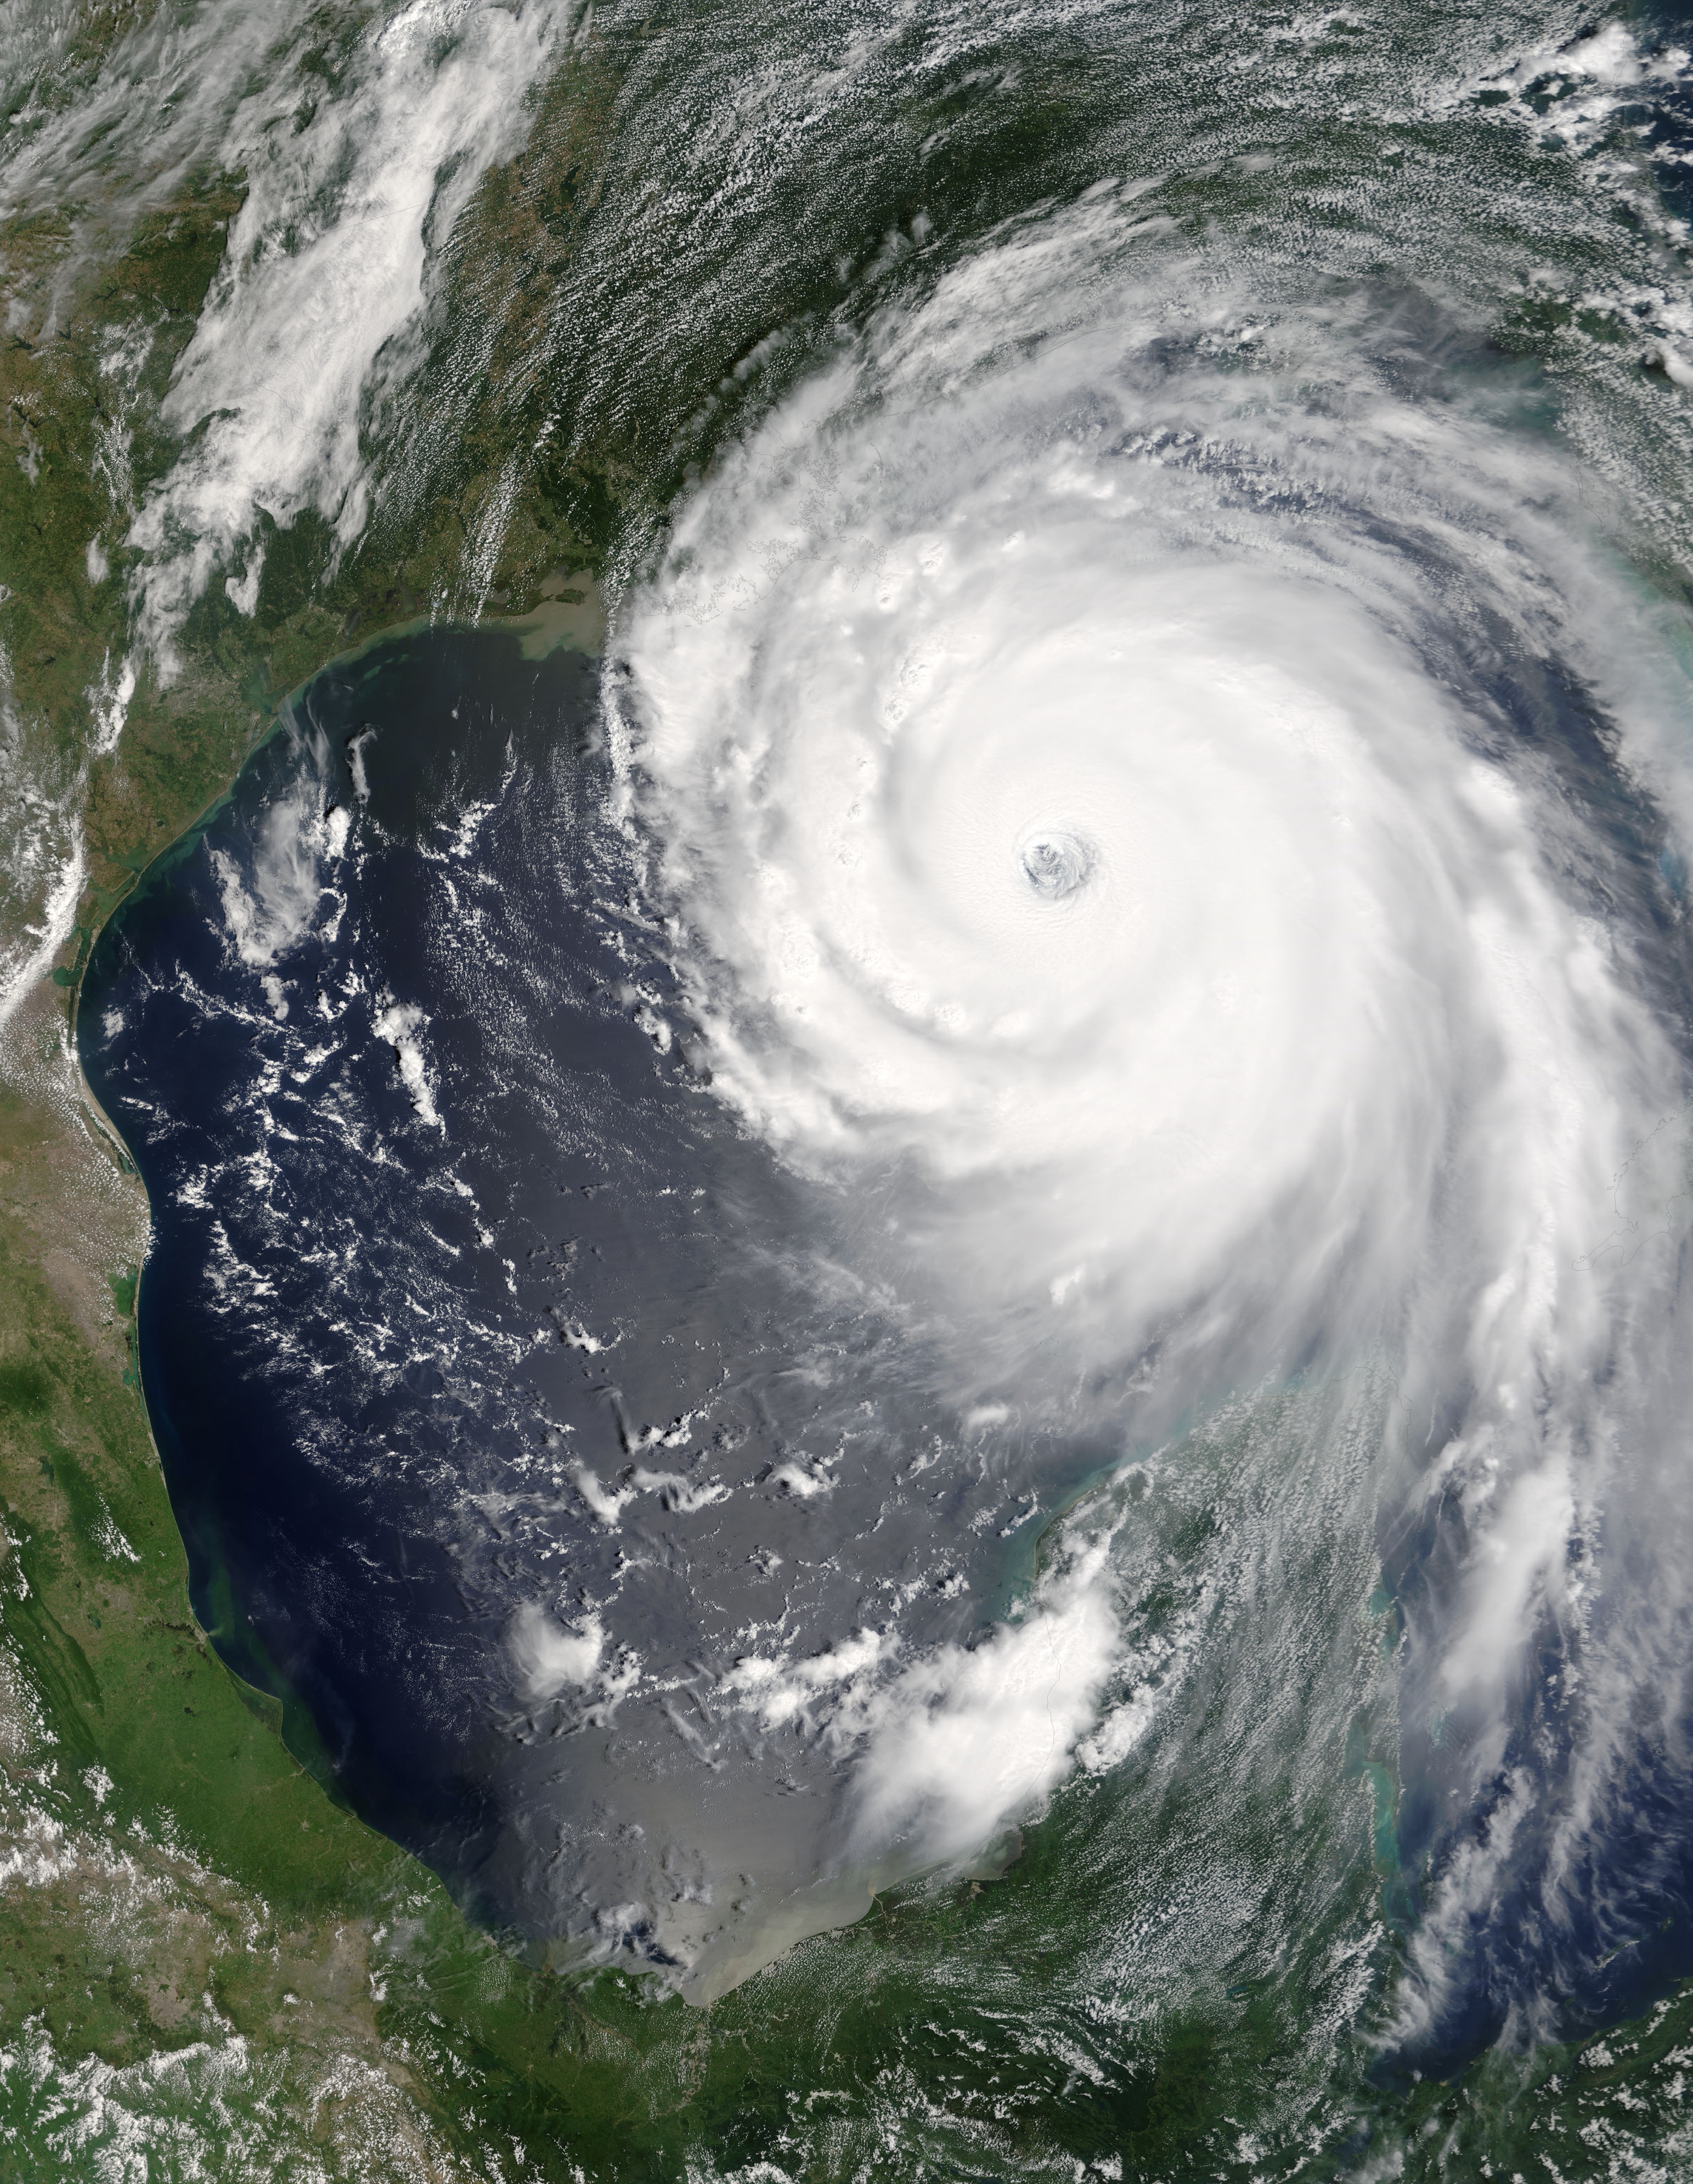
Katrina · GOES-12 · 28 Aug 2005
Home Research Hurricane Rapid Intensification
Research · North Atlantic · 1980–2024
Forty years of 6-hourly North Atlantic cyclone data, cleaned and modeled in a reproducible Python pipeline. Rapid intensification defined as a ≥30 kt wind-speed gain in 24 hours — a threshold that separates forecast-busting storms from everything else.
40+
Years of record
1980–2024
≥30 kt
RI definition
per 24 hours
6 h
Cadence
HURDAT2 / IBTrACS
2
Datasets
cross-validated
The question
Storm surge and wind exposure models depend on intensity forecasts 24–48 hours out. When a storm jumps two category levels in a day, every pre-positioned resource, every evacuation order, and every underwriting assumption based on the prior track goes stale at once. The goal here is empirical: establish the long-run RI frequency baseline, test whether the trend is real and significant, and characterize the synoptic environments in which onset occurs most reliably.
The answer matters beyond meteorology. Insurance pricing, reinsurance treaties, emergency operations, and infrastructure hardening all price in categorical forecasts. A systematic upward bias in RI frequency is a structural risk that current pricing cycles may not fully reflect.
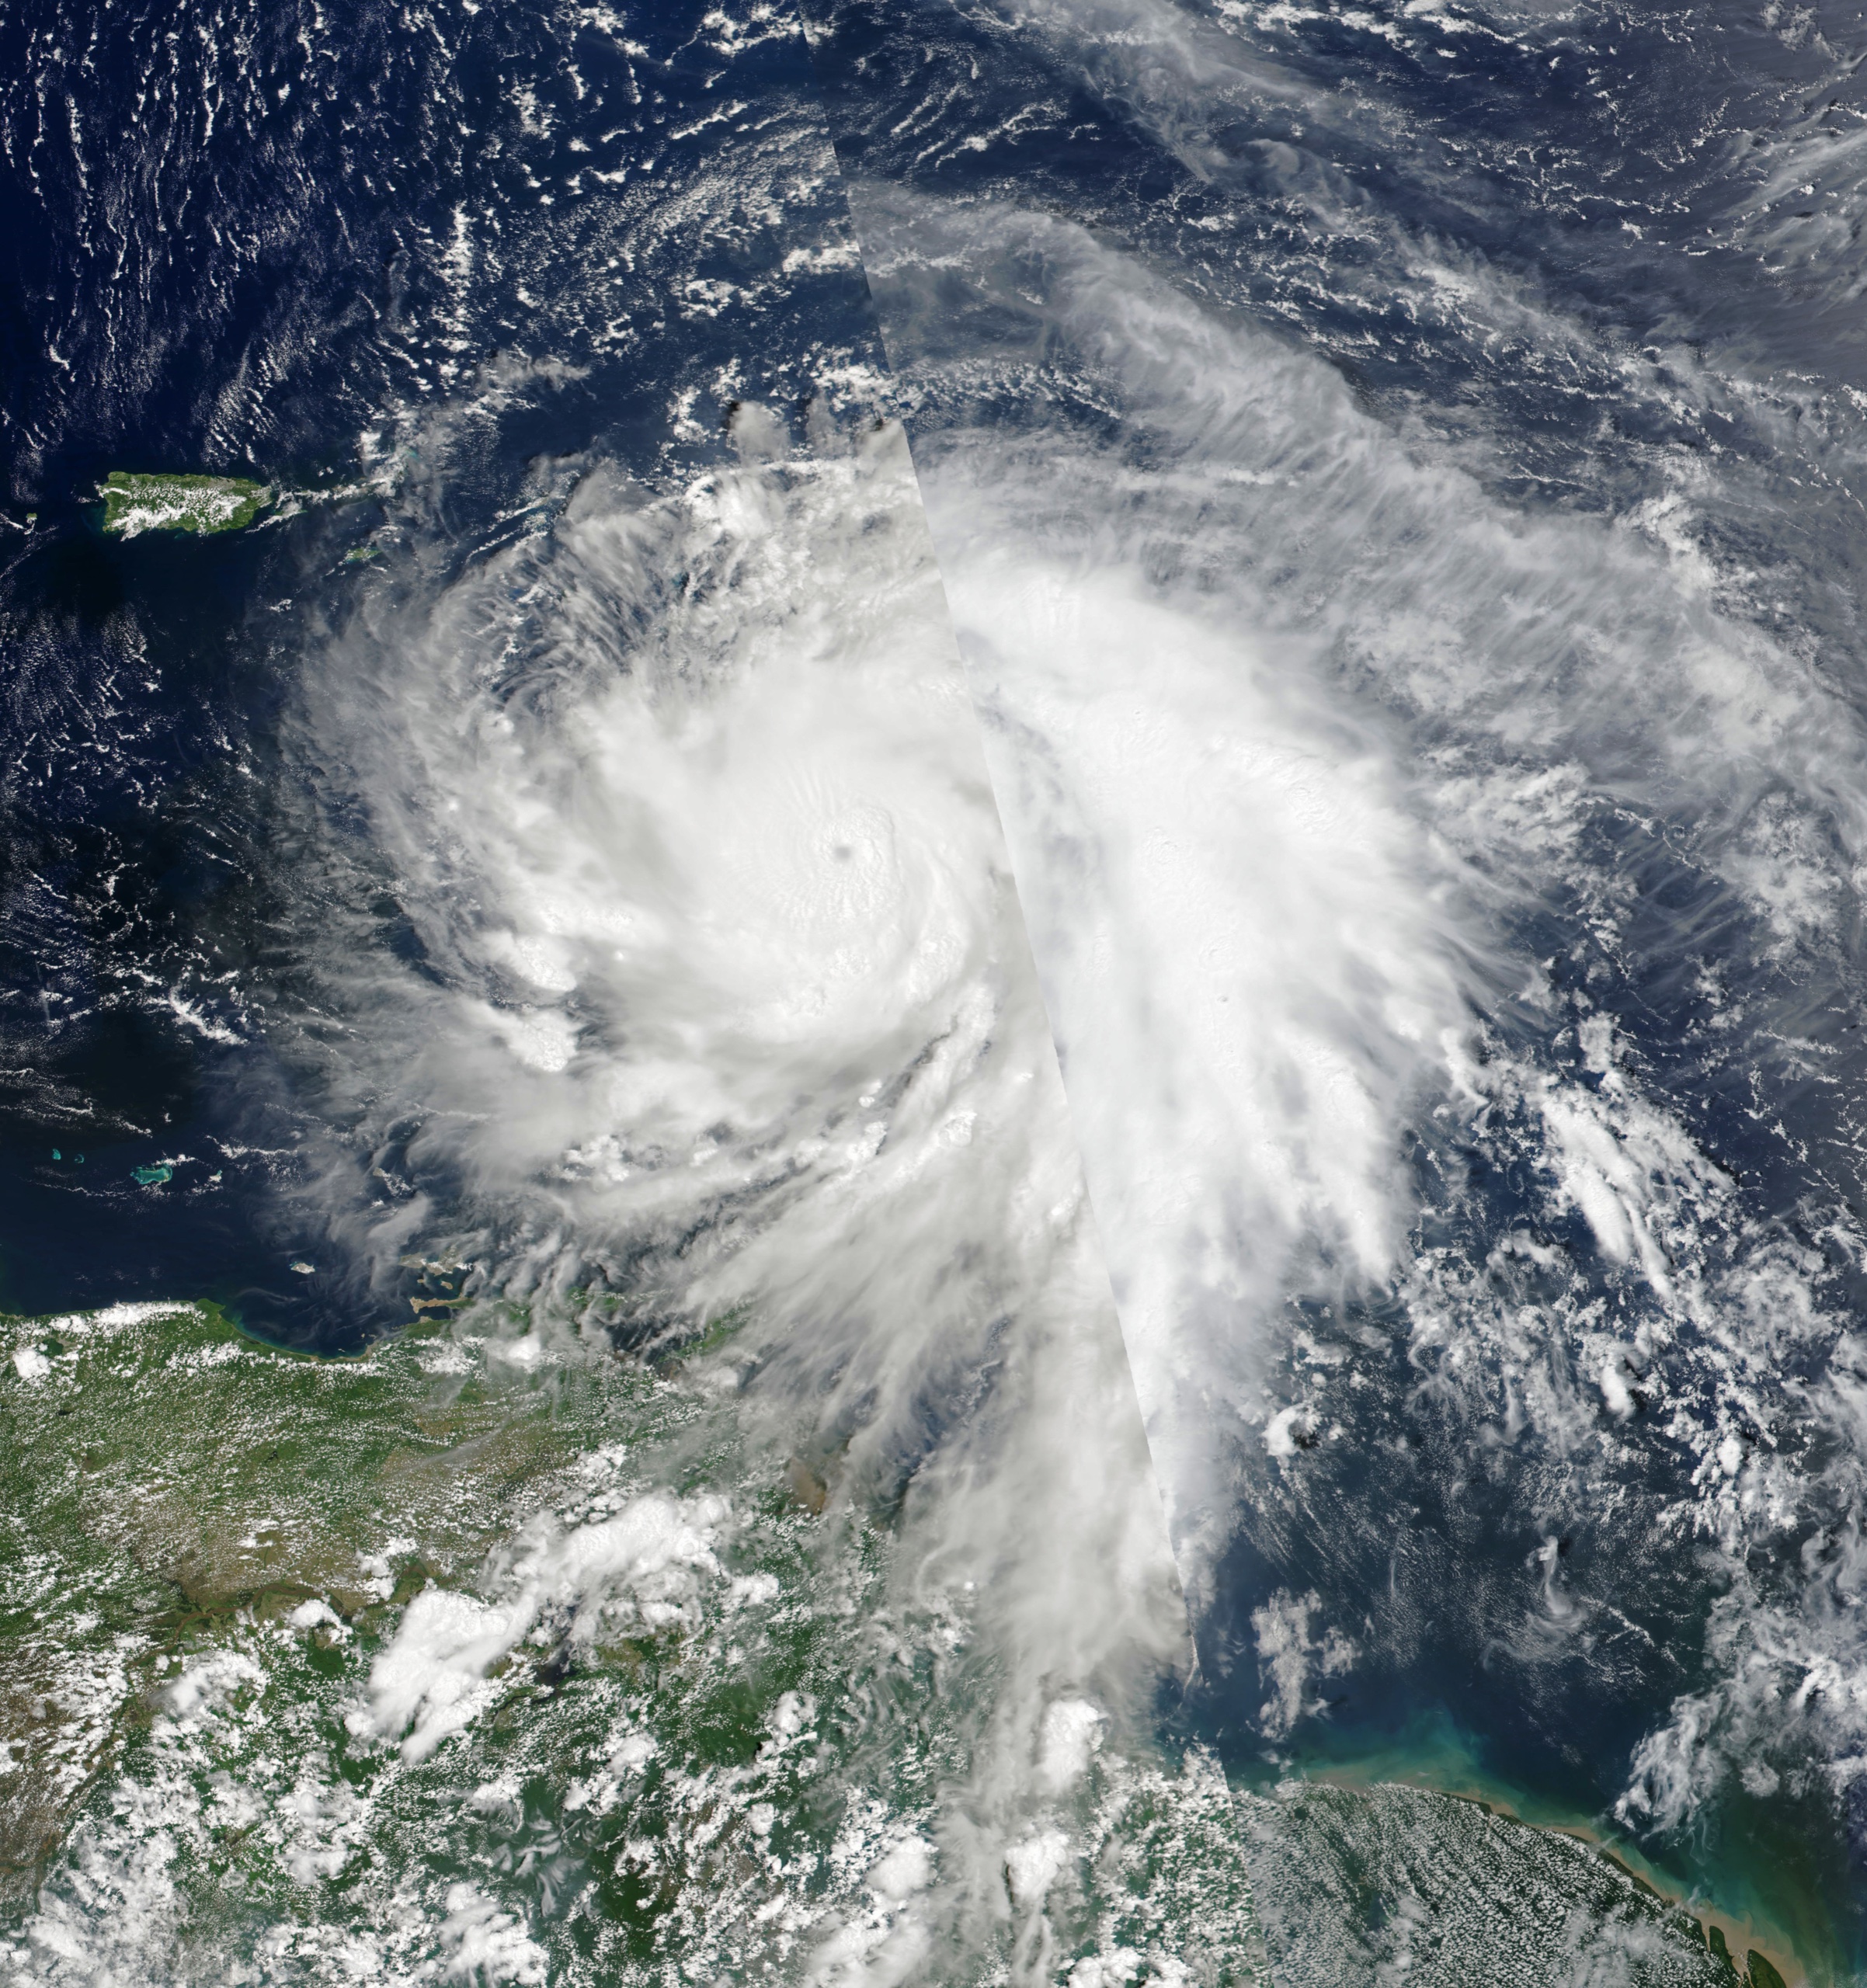
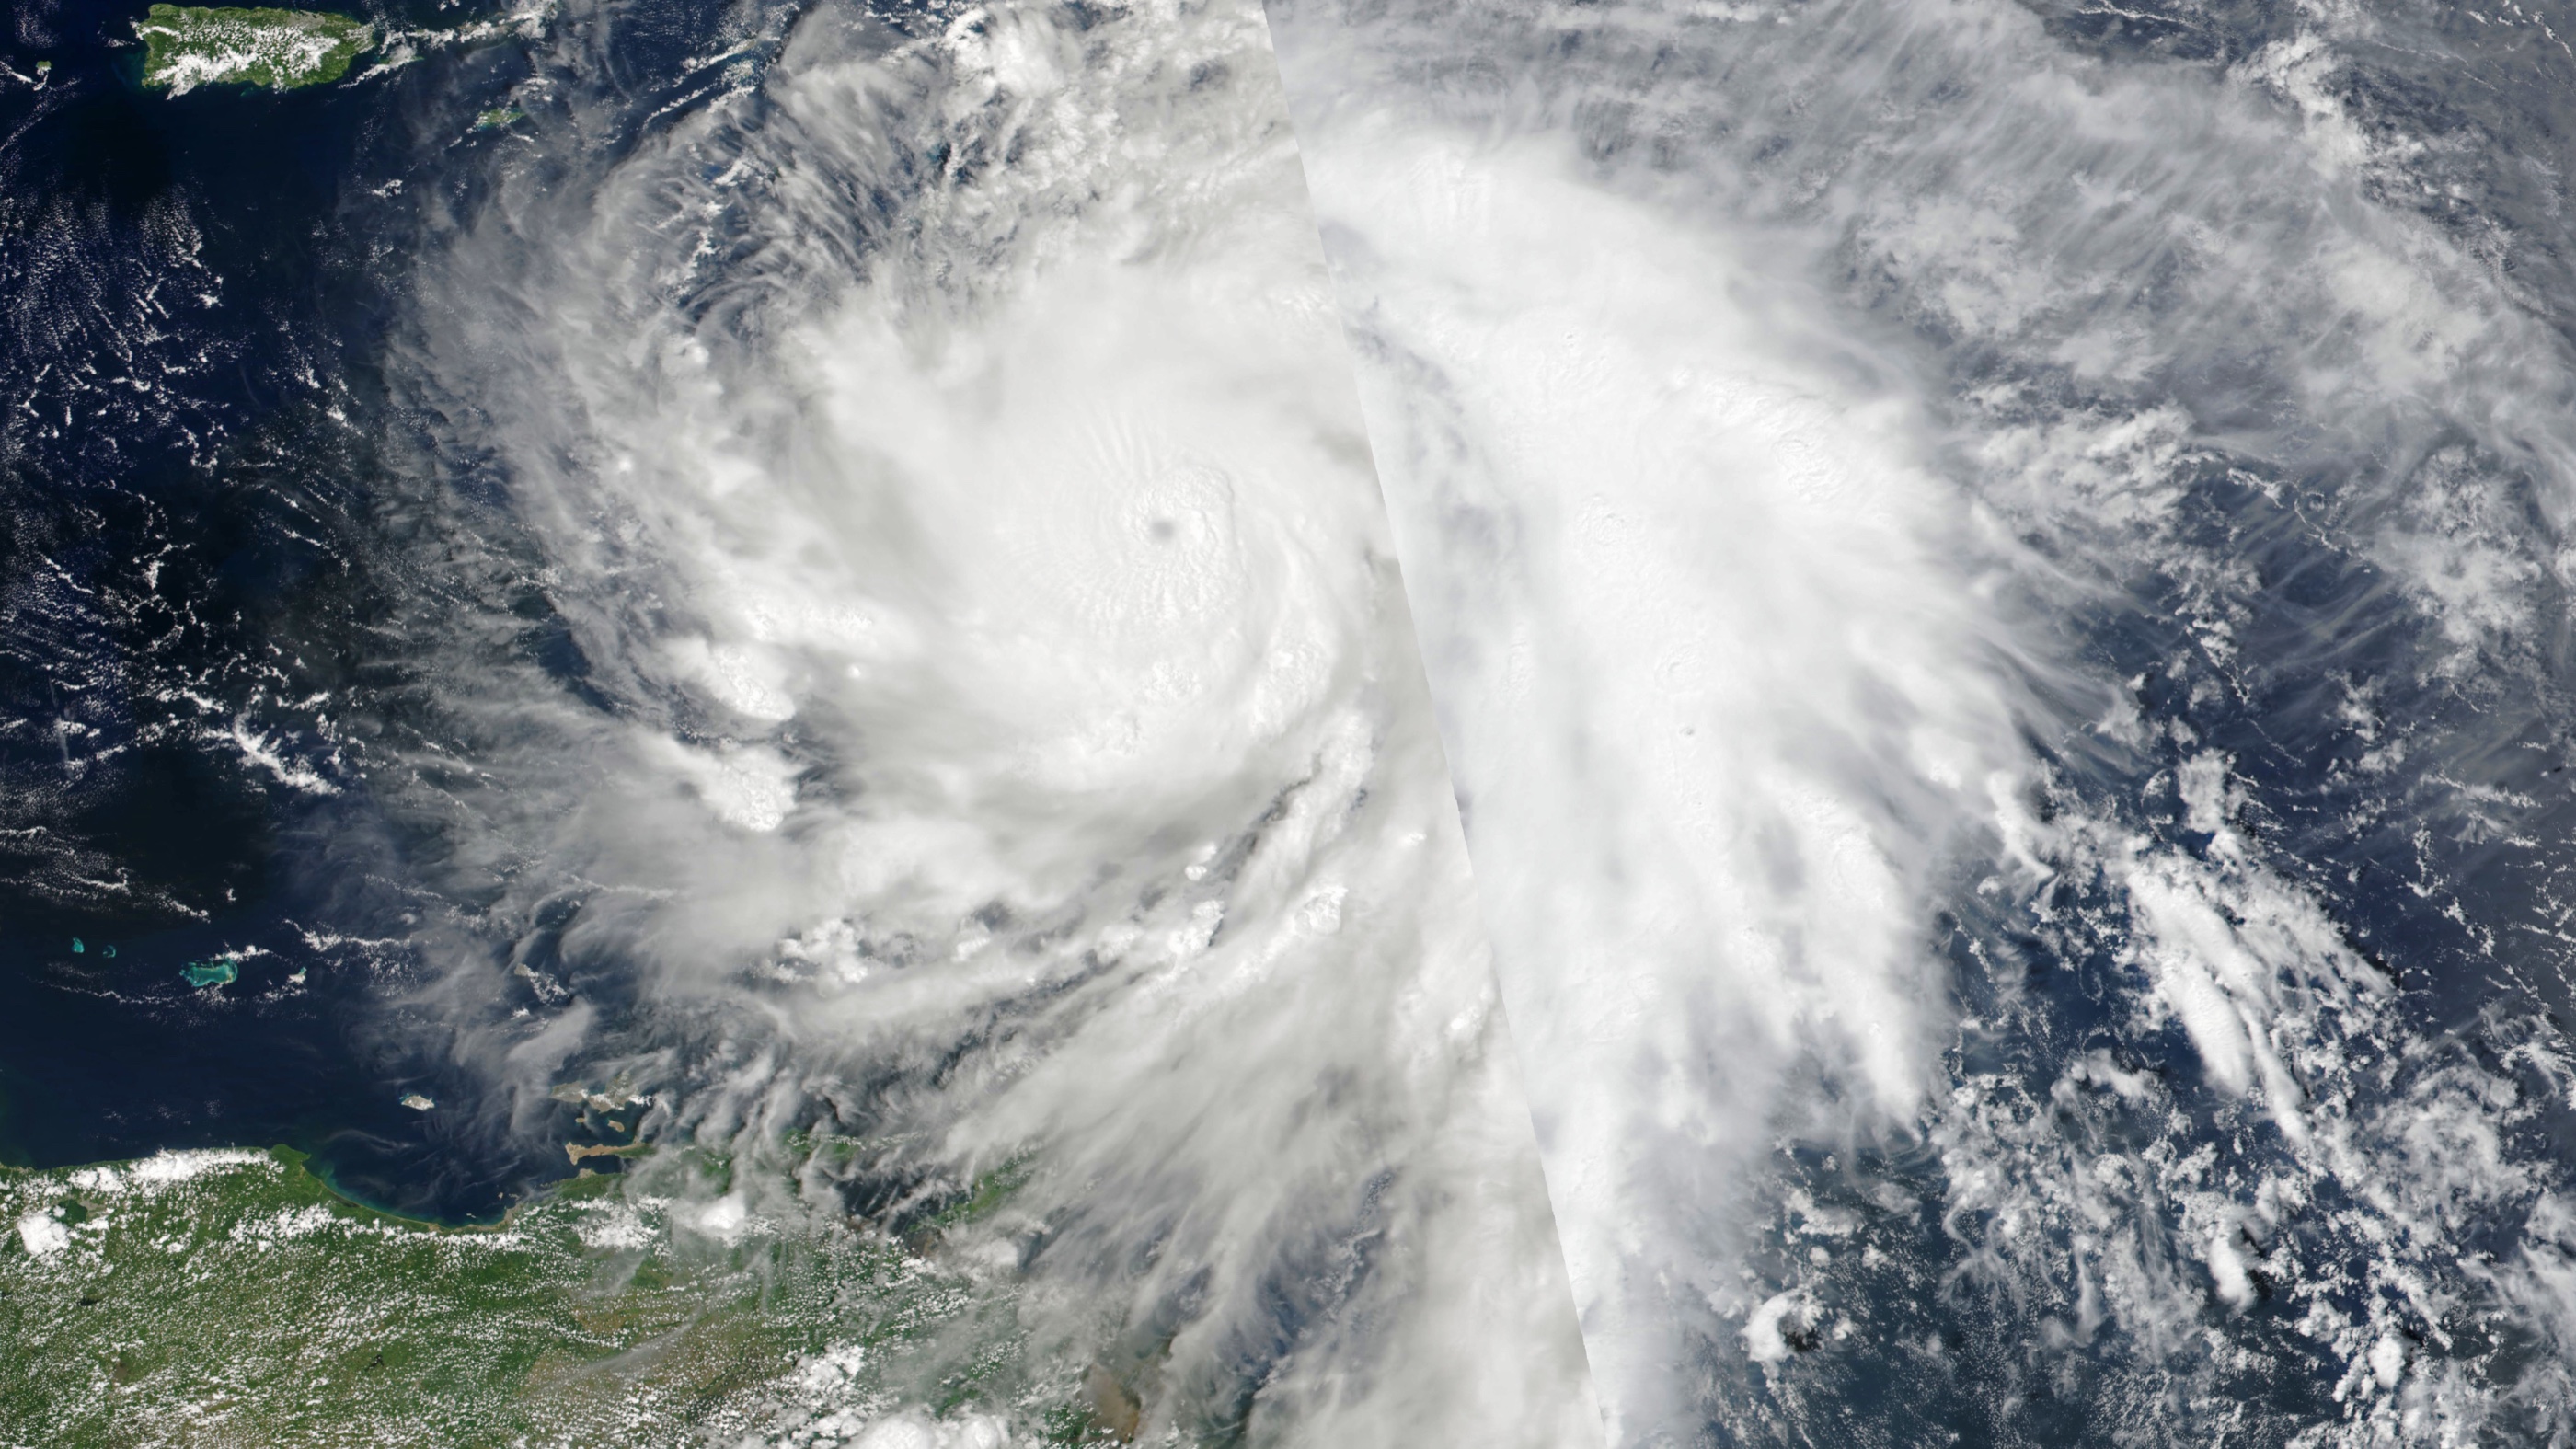
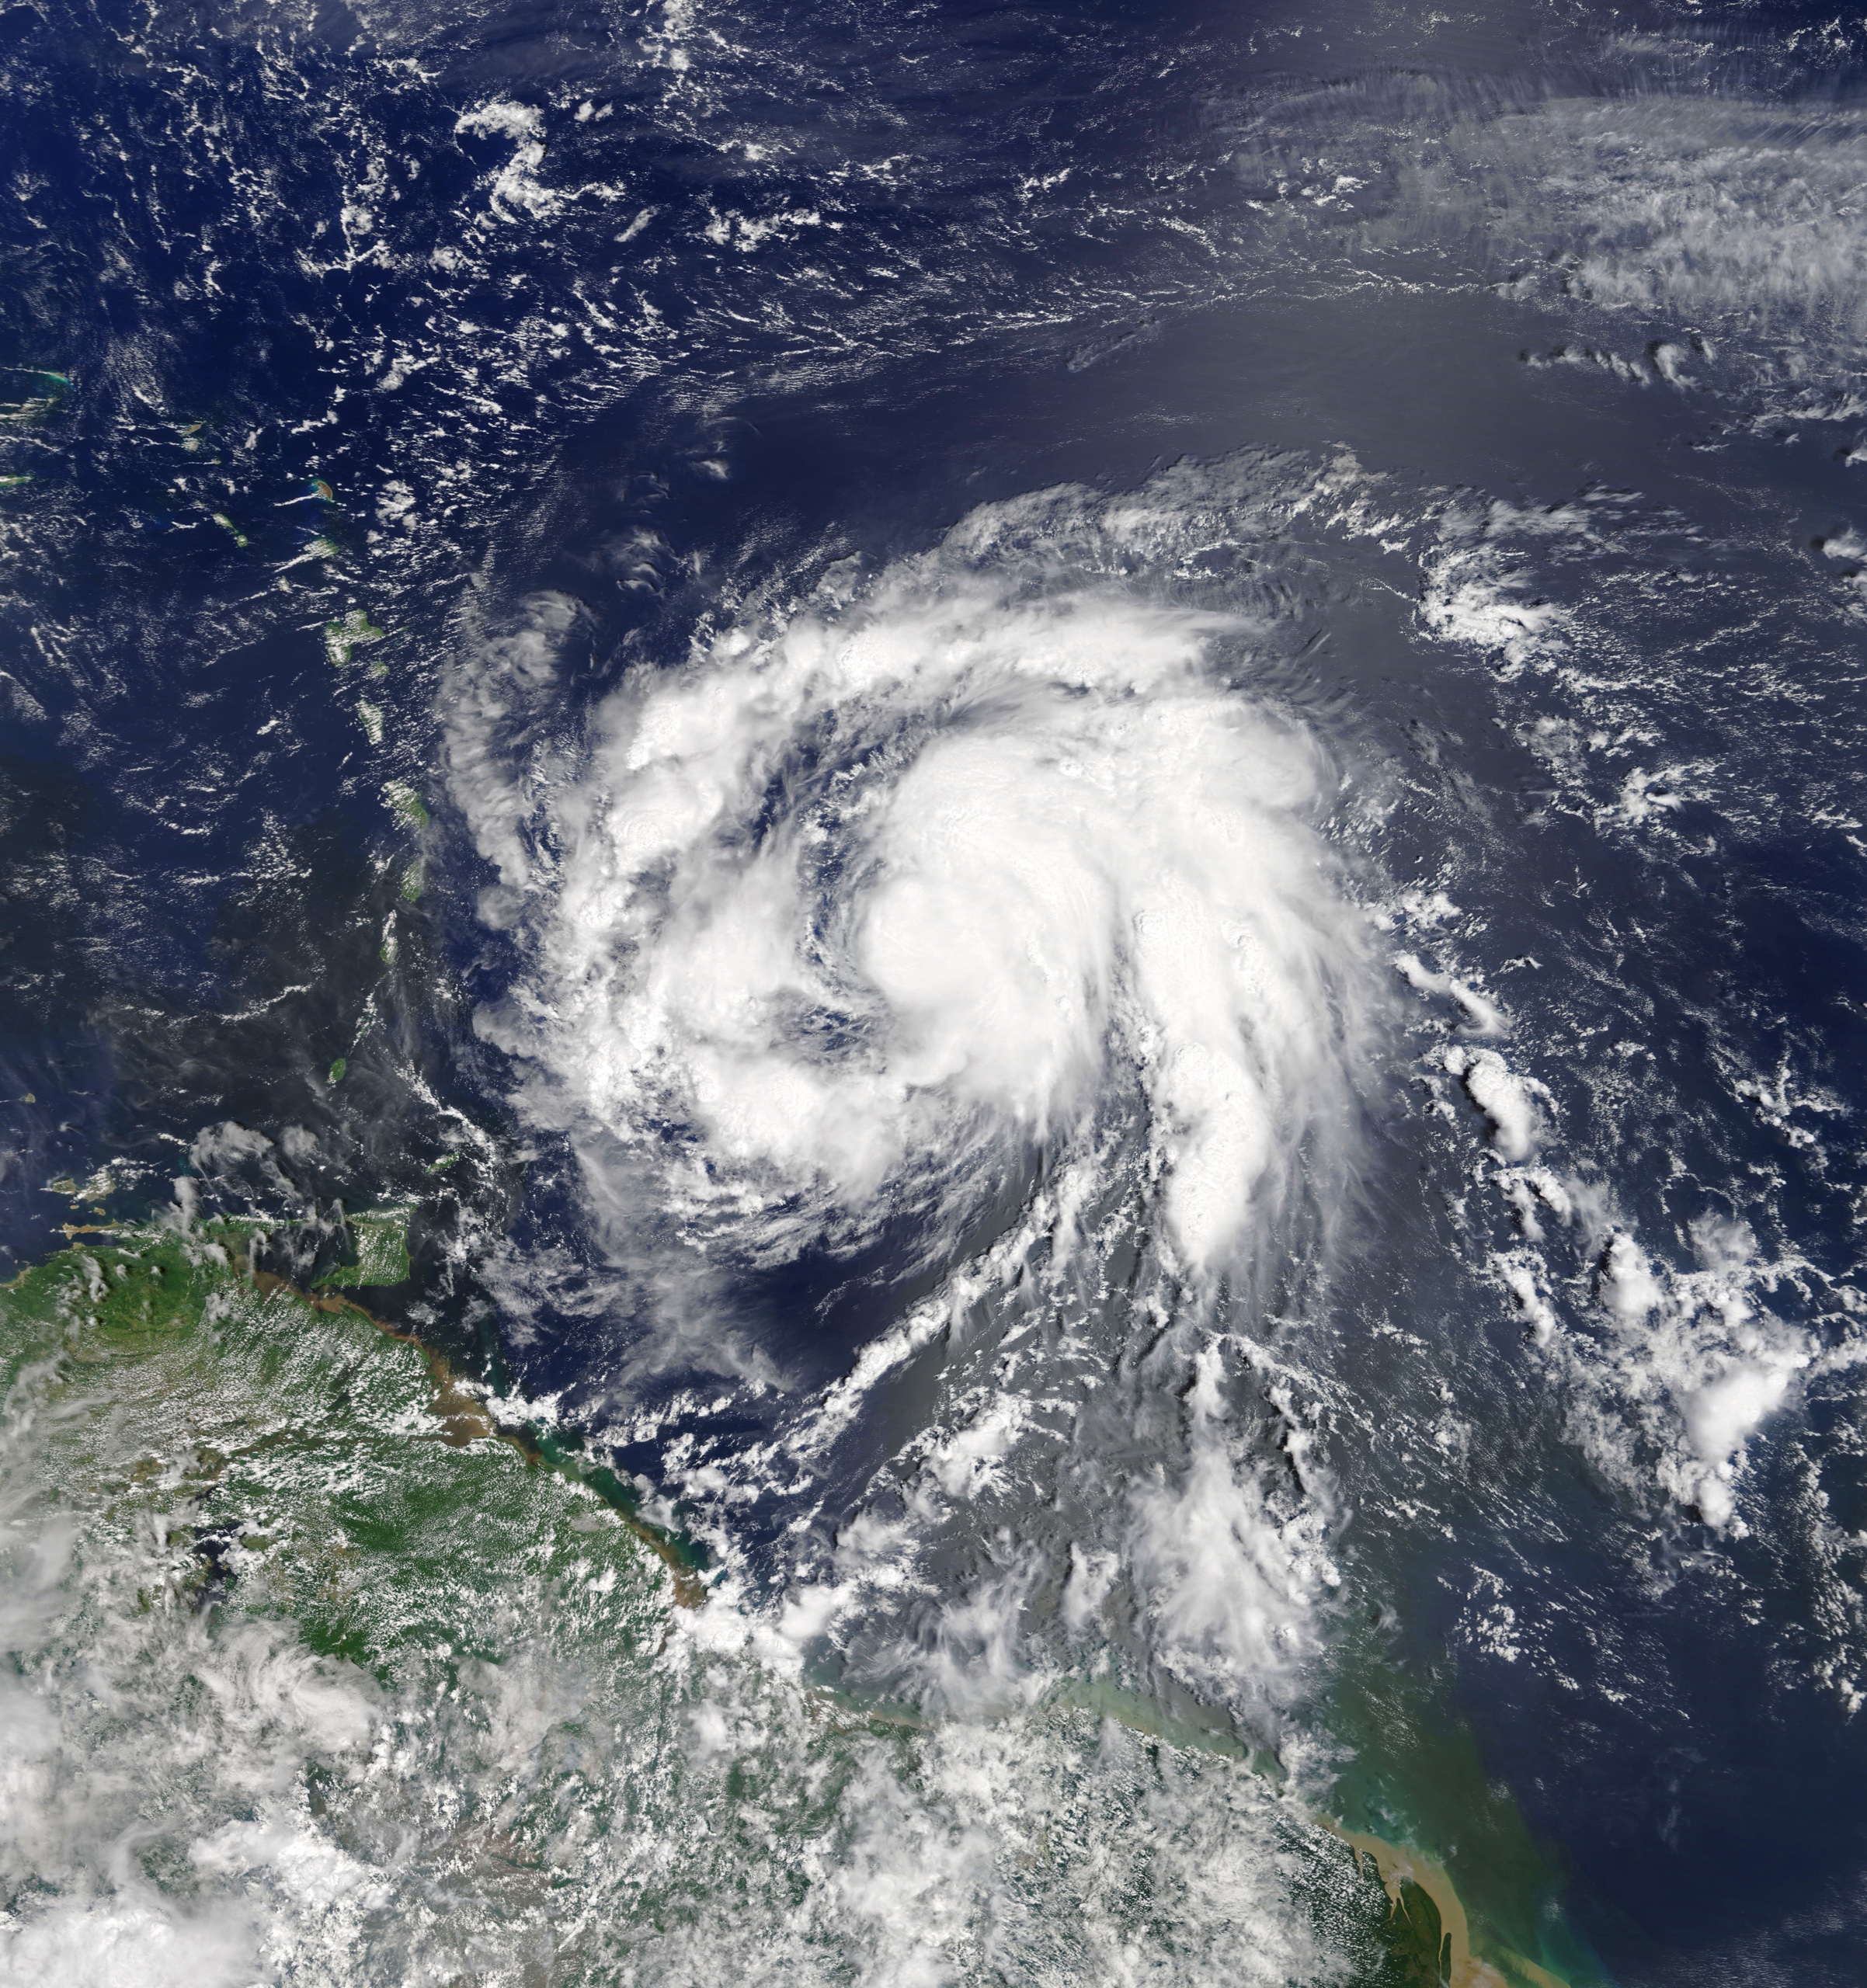
This is the jump the pipeline is built to flag. Maria went from a ragged tropical storm to a major hurricane in one day — a ≥30 kt 24-hour wind-speed gain, visible from orbit as a closed eye and a symmetric canopy. NASA Earth Observatory / LANCE.
24-hour wind delta · approaching landfall
TanStack Charts · dashed rule is the ≥30 kt RI threshold. Illustrative profile.
Storm tracks are schematic representations of North Atlantic basin activity. RI onset points cluster in the western basin and Gulf of Mexico where warm SST anomalies and low vertical wind shear create favorable development environments.
01
HURDAT2 best-track records (1980–2024) parsed from NHC fixed-width format into a normalized pandas DataFrame. Records with missing intensity observations flagged and forward-filled only where gaps are ≤1 step. IBTrACS v4 loaded as cross-validation reference.
02
For each 6-hour observation, compute the 24-hour forward wind-speed delta. Observations where Δv ≥ 30 kt tagged as RI onset. Consecutive RI flags collapsed to a single event to avoid double-counting sustained rapid deepening. Post-landfall points excluded.
03
RI event counts aggregated by season (June–November). Ordinary least-squares trend fit with 95% bootstrap confidence intervals. Mann–Kendall non-parametric test applied to confirm monotone direction without distributional assumptions.
04
Full pipeline in a single Jupyter notebook: raw download → cleaned parquet → figures. Environment pinned via conda-lock. Figures generated with matplotlib; all seeds fixed. Any researcher can rerun end-to-end from the public HURDAT2 URL.
+47%
increase in annual RI events
From the 1980s decadal mean to the 2015–2024 period. The trend passes both OLS and Mann–Kendall tests at p < 0.05.
≈ 8 events/season
2020–2024 average
The five most recent seasons average nearly double the 1980–1989 baseline of 4.2 events per season.
Gulf of Mexico
highest RI concentration
Warm loop current waters and frequent low-shear synoptic patterns make the Gulf the most RI-prone sub-basin by onset density.
18–36 h
median forecast lead time
At which the NHC intensity guidance currently shows measurable RI skill. Before 18 hours, onset is largely indistinguishable from climatology.
Annual RI events · 1980–2024
Data: illustrative representation of HURDAT2-derived counts.
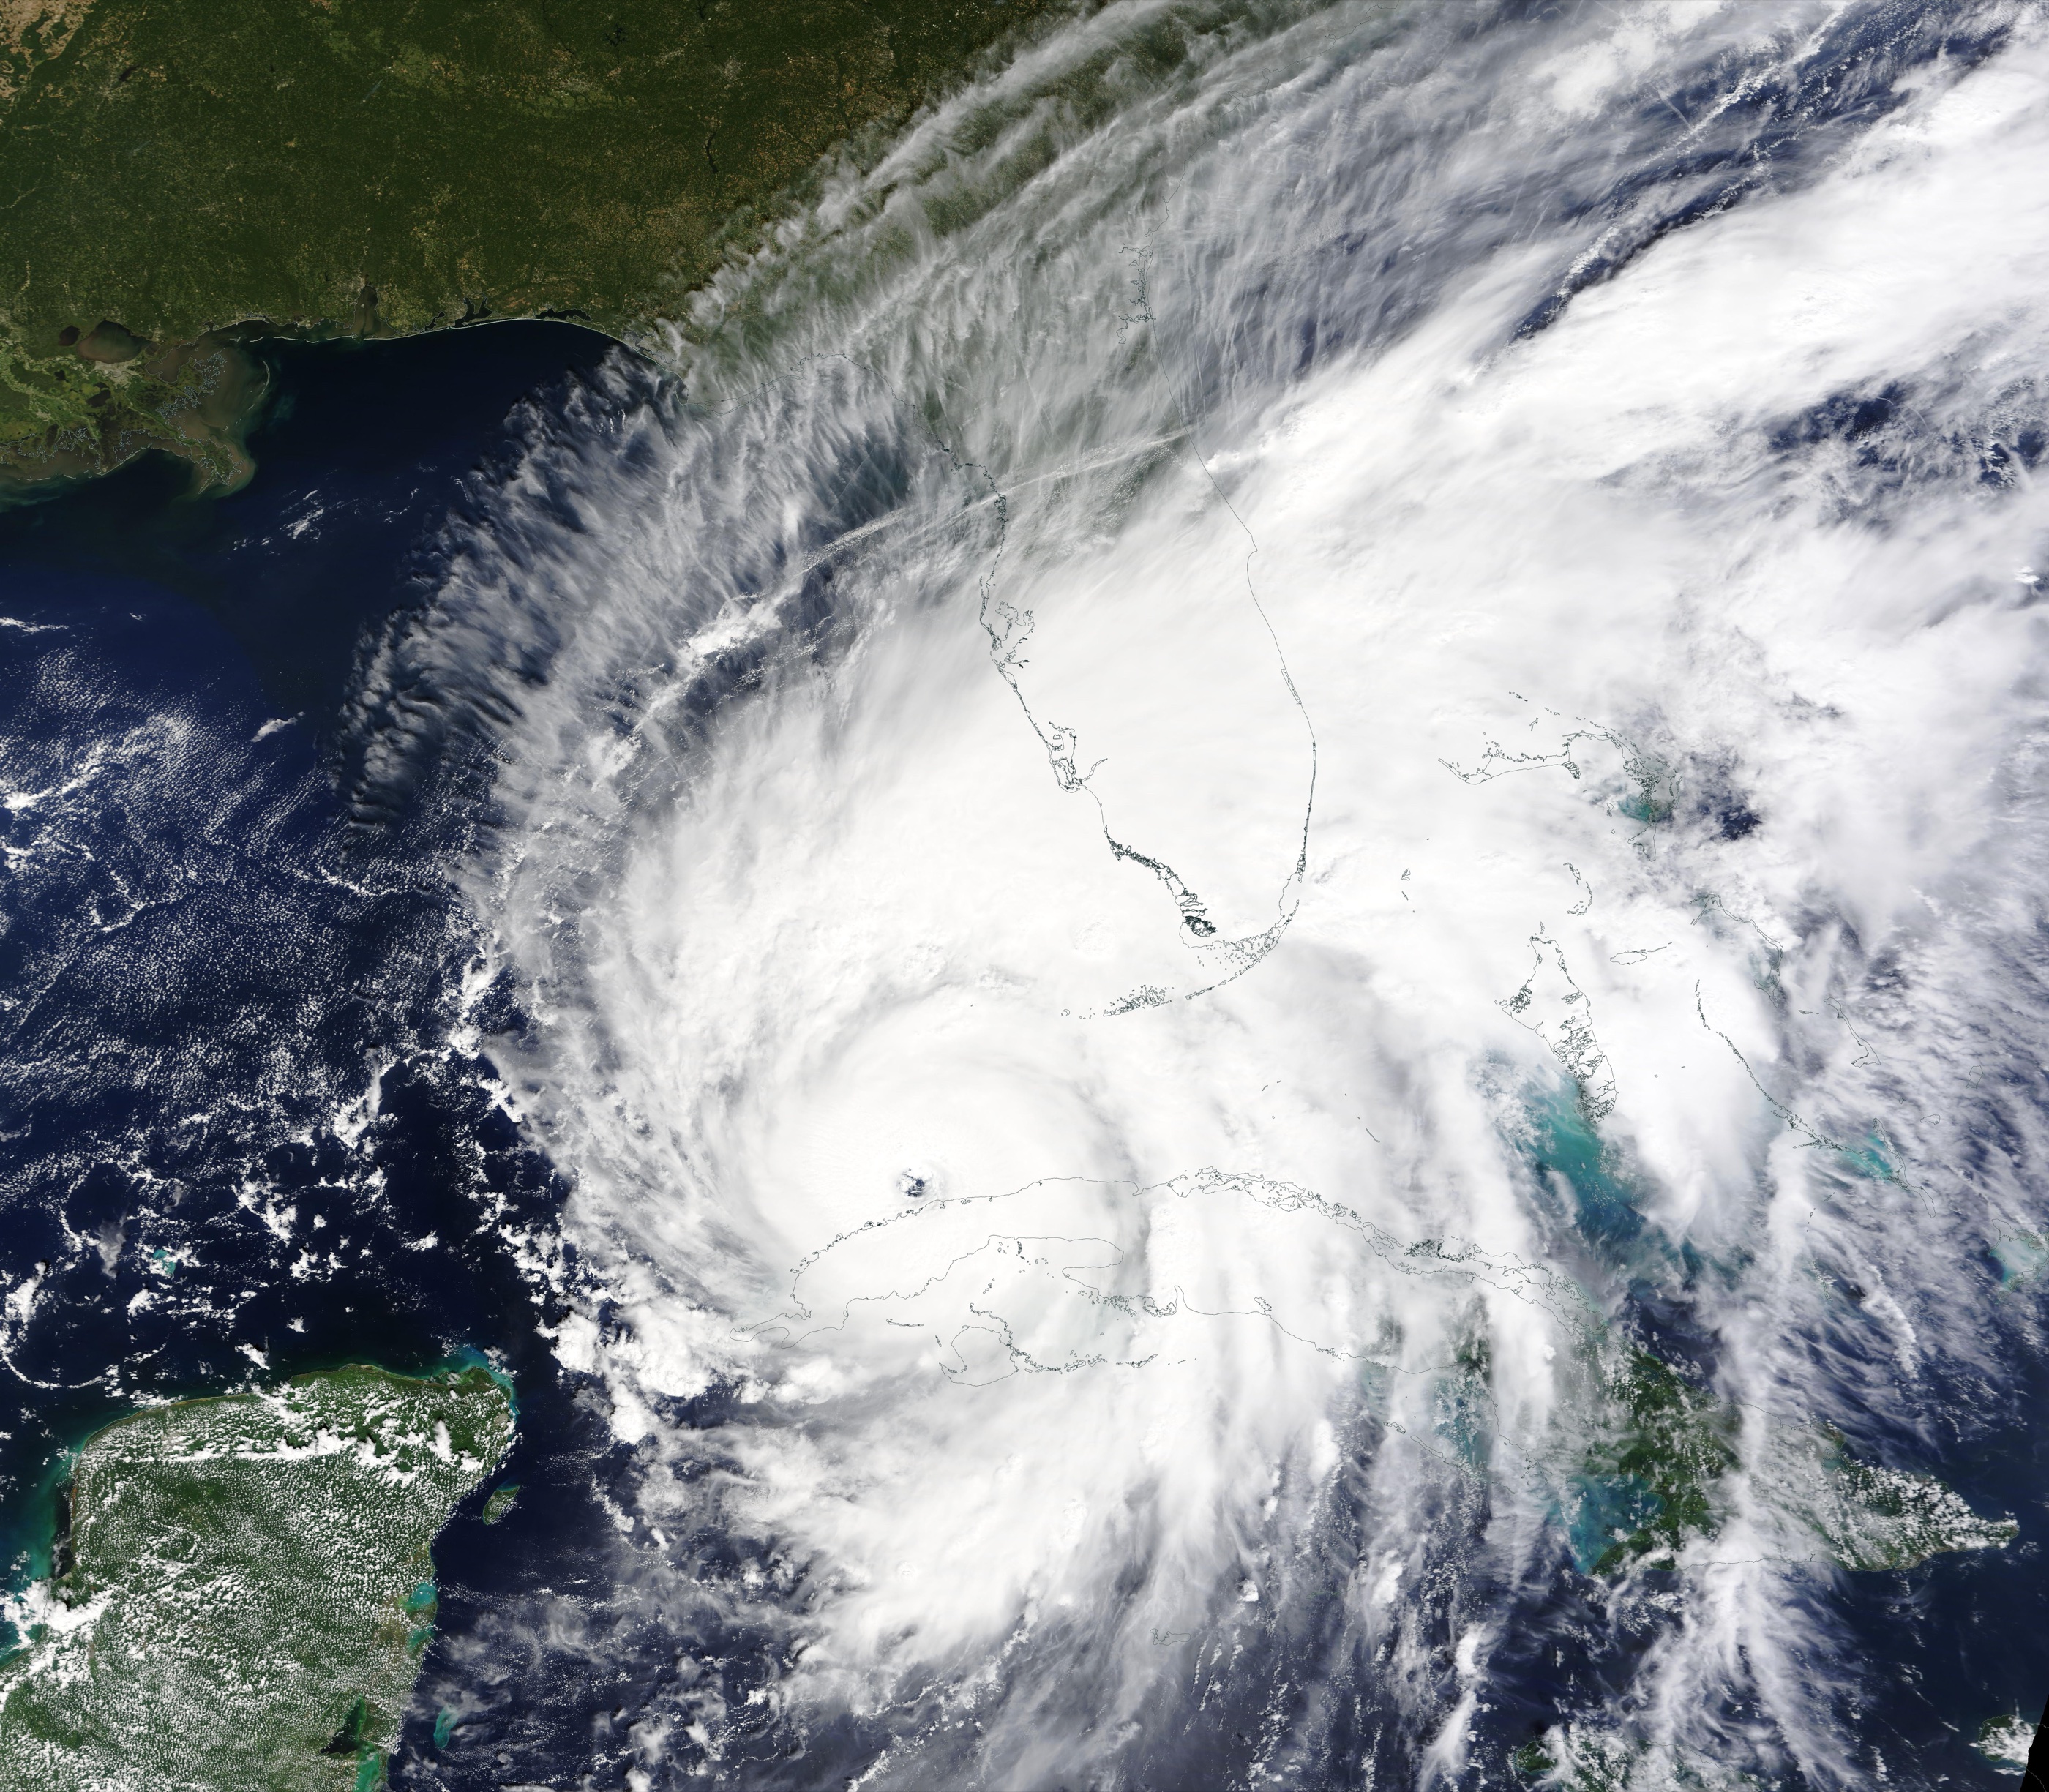
Ian on approach to the eastern Gulf — the same sub-basin where this record shows the densest RI onset. A closed eye and a symmetric canopy at this range is the satellite signature of a storm that has already taken the jump.
Mean RI events per season · three-dimensional
Each column is a decade × sub-basin cell. Height is mean RI events per season. The Gulf stack is the tallest in every decade; the 2020s lift is visible as amber caps. TanStack Charts, isometric projection of the same illustrative counts.
Pricing models calibrated on historical frequency assume a stationary distribution. If RI events are trending upward, expected loss curves understate tail risk. Re-calibration of exceedance probability tables is overdue.
Evacuation orders timed to Category 2 landfalls become dangerously conservative when a storm can become Category 4 in 24 hours. Improved RI predictability shortens the window between warning issuance and impact.
Building codes and hardening standards often reference the 50- or 100-year storm. A rising RI baseline compresses the return period for extreme-intensity events at any given location.
Identifying synoptic and oceanic precursors that reliably precede RI onset gives numerical weather prediction a target: resolve those precursors, and intensity forecast skill improves where it matters most.
Stack
Data sources
Reproducibility
Pipeline is a single notebook from raw HURDAT2 download to final figures. No manual preprocessing steps.
Environment locked with conda-lock. All random seeds fixed. Re-runnable by any researcher with the public data URL.
Next project
Catching epidemic rapid growth →